For some, this might mean we shouldn't pay attention to polling.
To me, to do so would be a mistake. Polling is still one of the best tools for understanding public opinion. While pollsters likely have some work to do to improve accuracy, those who ask for precision from polling are simply asking too much.
A look at the long arc of history suggests that the polling errors of the last few years should not be too surprising. In some ways, you would be right to call them average.
Let's start with what I think is the most important error of the 2020 election: the national polling. Yes, elections are ultimately state affairs, but most polls we use are national surveys. They help us understand where Americans stand on electoral issues and well as those outside of this realm.
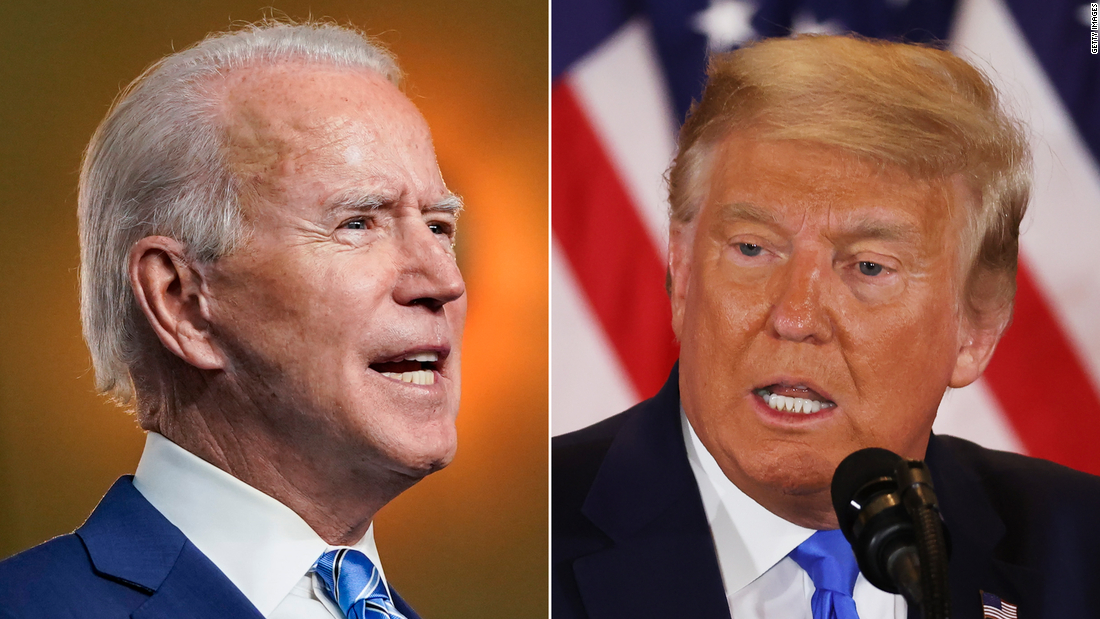
Different national polling aggregates had Biden ahead of Trump by anywhere from a little more than 7 points to 8.5 points. Biden's final margin in the popular vote was 4.5 points.
That's a big enough difference for the national polling average to be off by 3 to 4 points. The national polling average in 2016 overestimated Hillary Clinton's margin by less than 2 points, so the polling this year was worse.
Obviously, we'd prefer the polling to be better. It's not good that the polling in two elections in a row underestimated Trump.
But we should be clear about the extent of the error we're talking about here. The polls (when allocating undecideds evenly and concentrating on the major party candidates) had Biden winning approximately 54% to 46%. He won on the order of 52.25% to 47.75%.
In close elections where the margin between the candidates is within 5 or 10 points, which all nationally have been in the last 32 years, a 4-point error can make a big difference.
Most issues, however, are not so evenly divided.
We can still feel quite confident that when polling finds that more than 55% of Americans agree on something, then a majority almost certainly do. (Note: additional potential errors from question wording and other areas where polling has erred such as volunteer work can add even more uncertainty.)
Indeed, approximation is what polling should generally be used for. I noted throughout this past election cycle that Biden and Trump were within the "true margin of error" of each other. That is, the error necessary for Trump to win has occurred more than 5% of the time in past elections.
We may have gotten spoiled in some recent years with how close polling came to the outcome. The national polls differed from the final outcome by about a point in both 2004 and 2008.
Historically, however, polls can be much further off. A look at the final public polling aggregates since 1936 show that the polling errors have averaged about 4 points, or about what they were this year.
If you were to construct a 95% confidence interval for the "true margin of error" since 1936, it would be about +/- 10 points. The national error this year wasn't anywhere close to that.
Historically, polling errors were greatest from 1936 to 1952, when scientific polling was first getting started. The polls also seemed to consistently overestimate one side in that era (Republicans).
We've obviously come a long way since then. That said, pollsters have new challenges. Some are specific to 2020 (e.g. the pandemic). Others are applicable to other cycles (e.g. declining response rates and the large number of pollsters using newer techniques such as online polling).
Pollsters probably need to and will likely figure out how exactly to deal with those issues.
For now, analysts, journalists and consumers have to recognize that merely repeating the sampling margin of error produced on major polls likely isn't likely going to cut it. There are other sources of error not incorporated by the sampling margin of error that can rear their head.
This is especially true on the state level where the state polling left much to be desired in 2020, as it did four years ago.
The FiveThirtyEight polling average, for example, was off by about 5.5 points in the states where the final polling had the race within 10 points, after being off by 4.4 points in 2016.Since 1972, the average error was 3.3 points in states within 10 points in the final polls. (Unfortunately, we don't have state polling since 1936 to compare it with. You could bet the historical error rate would be higher if we could go further back in time.)
The 2020 state polling was nearly the worst on record since 1972. Only 1980 with an average error of 5.6 points was worse.
More worrisome, the direction of the errors (Republican underestimation) was the same in both 2016 and 2020.
This is absolutely something that must be examined more, and it's likely to be by pollsters and their critics.
Still, these errors shouldn't be shocking.
Since 1972, the 95% confidence interval for state polling averages in competitive states has been a little more than +/- 9 points. We had two competitive states (Montana and Utah) exceed that, and both by less than 2 points. We should have had about one based on history.
So what does this mean for consumers?
When one side is ahead of another by more than a few points, that advantage is probably real, even on the state level. It's not until that lead is closer to double-digits that we know that edge is real outside of rare circumstances.
Perhaps the best way to think about the state polling (and polling at large) is to borrow a phrase from the Trump era: take it seriously, but not too literally.
"how" - Google News
December 26, 2020 at 08:24PM
https://ift.tt/3rxMPsi
How to think about polling after 2020 - CNN
"how" - Google News
https://ift.tt/2MfXd3I
Bagikan Berita Ini


0 Response to "How to think about polling after 2020 - CNN"
Post a Comment