NOAA scientists provide outlooks for high tide flooding

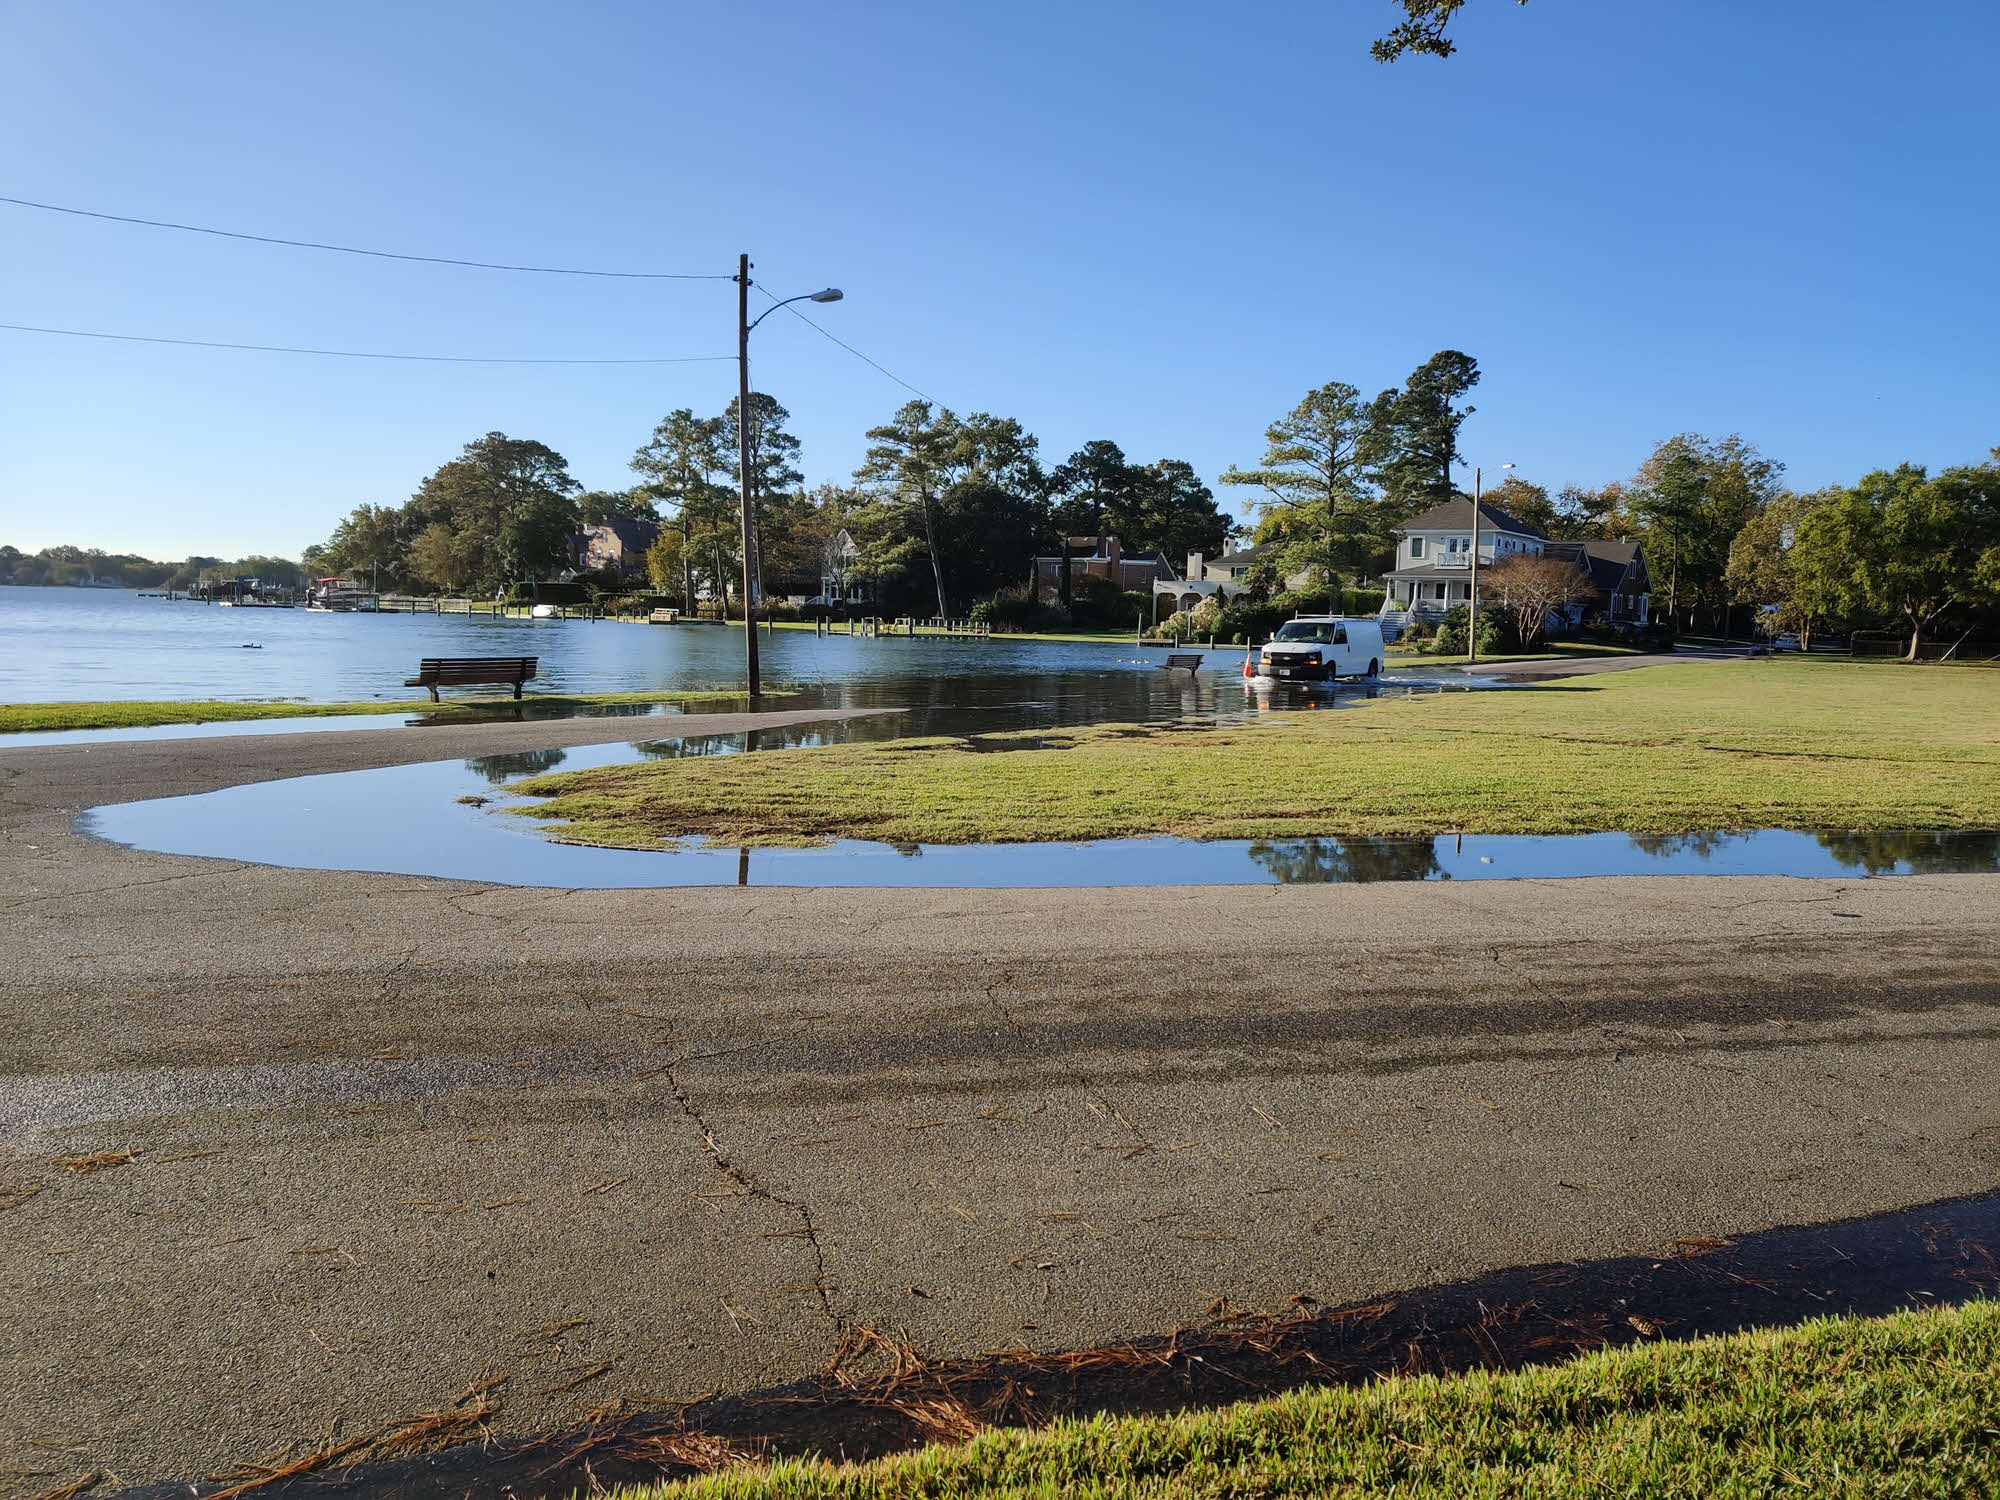
Nuisance flooding is a national issue. These flooding events often occur at high tide during full and new moon cycles. This type of flooding can be observed on sunny days causing streets and low-lying areas to flood due to increased sea heights. Rainfall or storm events can amplify the impacts of nuisance flooding putting further stress on infrastructure such as stormwater systems, roads, and pumping stations while causing property flooding and water quality issues.
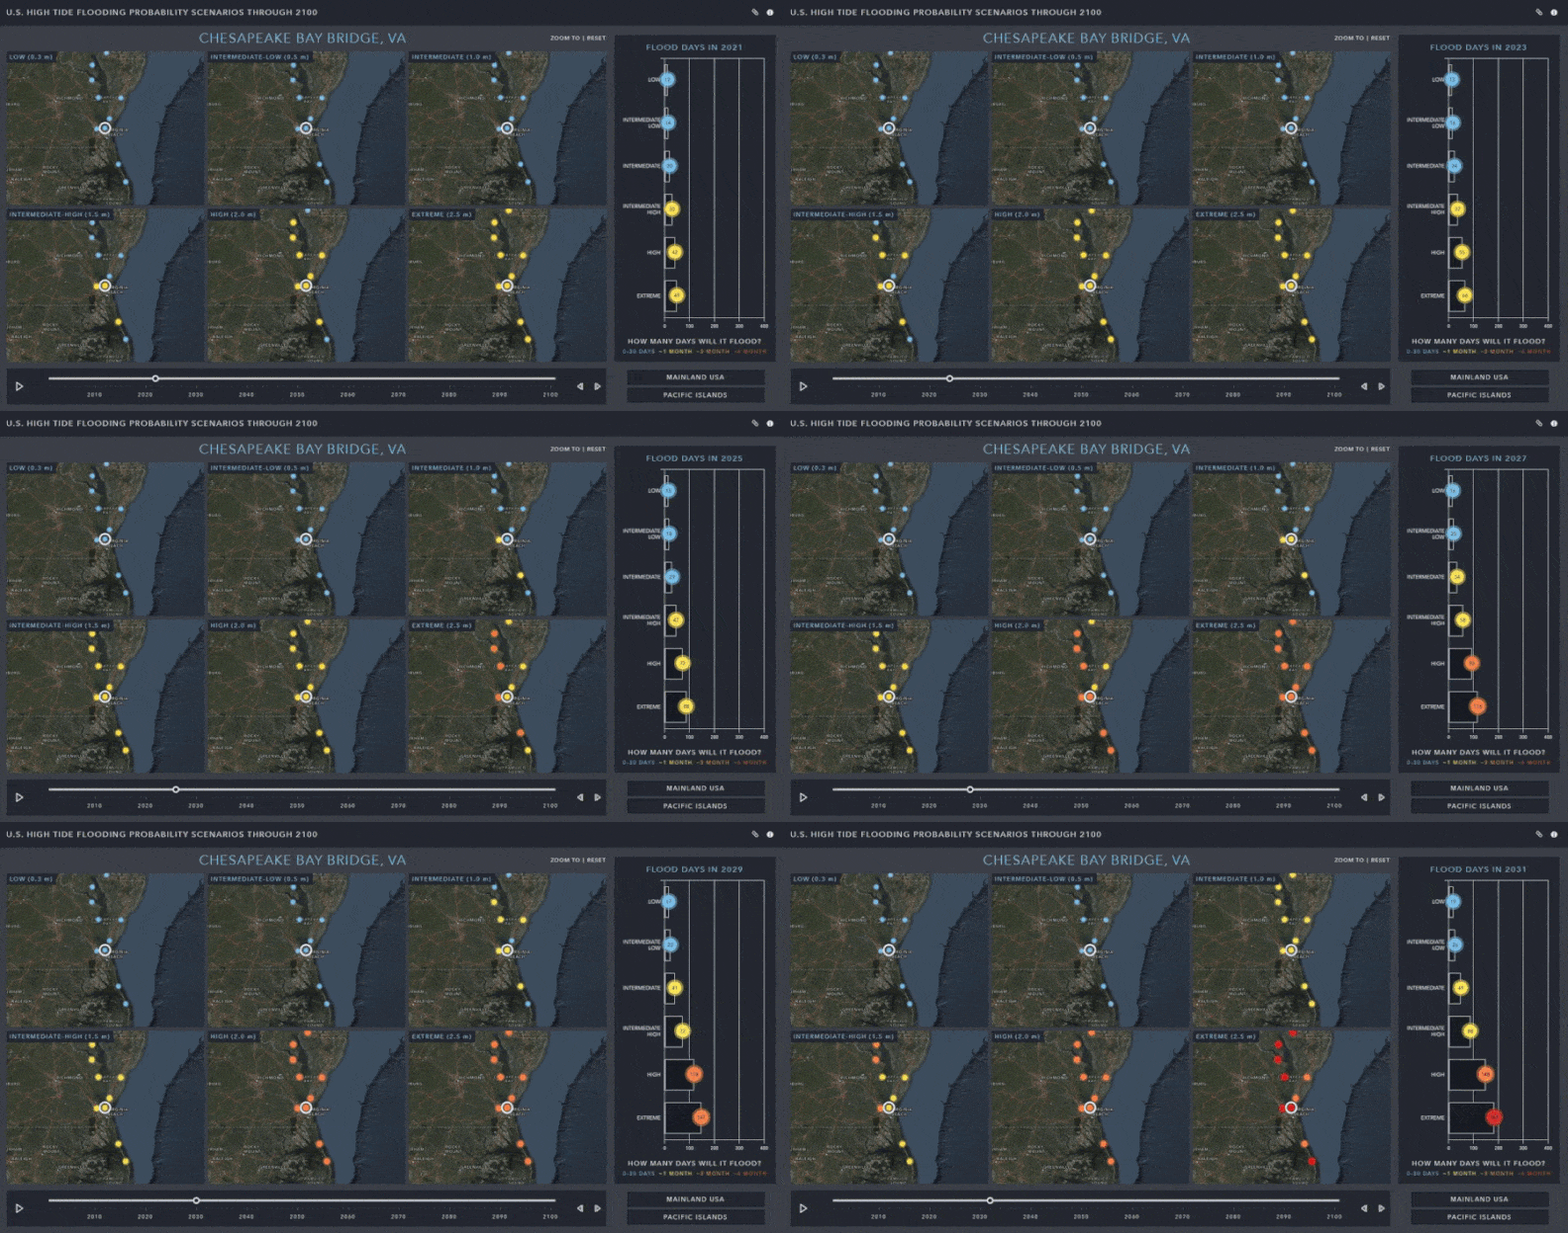
The six different maps represent global-mean sea level rise scenarios that range from 0.3 meters for the low scenario to 2.5 meters for the extreme scenario. The number of flooding days at each of these locations are presented in the graph.
Nuisance flooding worsens as sea level rise increases. Locations such as Chesapeake Bay Bridge, VA that are expected to observe 20 days of nuisance flooding in 2021 are predicted to at least double the amount of flooding days within ten years expecting 49 days of flooding.

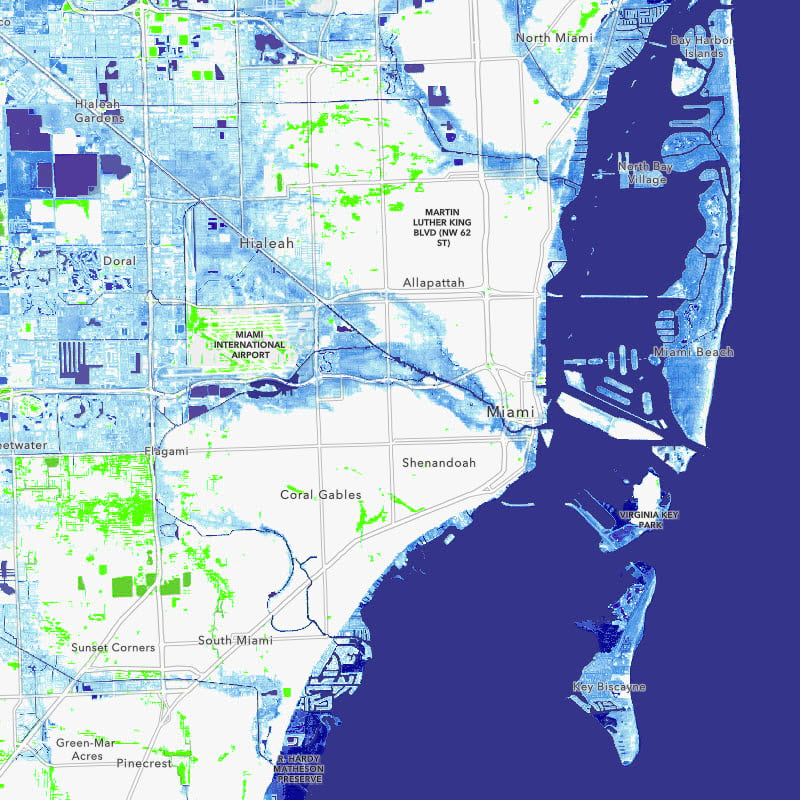
Coastal communities are most impacted by nuisance flooding. Cities such as Miami, FL, Charleston, SC and Alexandria, VA have built up seawalls to help deal with the issue and minimize impacts in vulnerable areas. High Tide Flooding Outlook projections provided by NOAA allow us the insight that the issue is only going to get worse. At what point do we begin to retreat more landward to allow these natural processes to occur? When do coastal management mitigation efforts become too costly and we allow the natural process to take over the areas that are constantly inundated?

The High Tide Flooding App allows quick visualization and understanding of U.S. high tide flooding probability scenarios through 2100. Users can quickly assess how many flooding days are expected to occur within coastal communities each year for the different flooding scenarios ranging from low to extreme. The application also allows sharing of a location and impact year so you can share links with colleagues or quickly compare outlooks.
Coastal planners and state and local municipal leaders, regional planning councils and alike need this information to better understand potential impacts to help plan accordingly. Increasing this understanding can help impact policy and protect the investments of citizens.
This data was sourced from NOAA Technical Report NOS CO-OPS 086: Patterns and Projections of High Tide Flooding Along the U.S. Coastline Using a Common Impact Threshold and aggregated for visualization and sharing in ArcGIS Pro. This application was built with the ArcGIS API for JavaScript. You can find the supporting layer in the Living Atlas of the World.
"how" - Google News
March 06, 2021 at 02:50AM
https://ift.tt/3uXovSe
How many days will it flood? - esri.com
"how" - Google News
https://ift.tt/2MfXd3I
Bagikan Berita Ini


0 Response to "How many days will it flood? - esri.com"
Post a Comment